Cost monitoring in Snowflake using Streamlit
Introduction
In the ever-evolving realm of cloud computing, businesses are racing towards data warehouse solutions that offer unparalleled scalability, flexibility, and performance. Snowflake, a cloud-based data warehousing platform, has emerged as a frontrunner in this domain, empowering organizations to harness the power of data for informed decision-making. However, as businesses delve into the Snowflake environment, they soon realize that the benefits come together with the need for vigilant cost monitoring.
In response to the demands of managing cost within the Snowflake ecosystem, we're refining our approach to cost monitoring. Recognizing that each business case is unique, we're focused on developing a customized cost monitoring solution tailored to specific organizational needs.
Our strategy centers on empowering users to align costs accurately with their distinct business Use Cases. This is achieved through the implementation of Resource Monitors, enabling granular allocation of expenses to the activities driving them. While the technical aspects are vital, our emphasis extends beyond implementation to encompass the strategic integration of cost monitoring with business objectives.
To achieve this, we're leveraging Streamlit, a versatile Python framework renowned for its user-friendly interface and interactive capabilities. Paired with Snowpark, the Snowflake Python connector, Streamlit seamlessly integrates with Snowflake, providing a platform for building custom cost monitoring applications.
Through this approach, we're not only addressing the technical requirements of cost monitoring but also facilitating a deeper understanding of cost drivers within the context of specific business Use Cases. By aligning our monitoring strategy with the intricacies of each organization's operations, we're empowering users to make informed decisions that optimize costs and drive strategic outcomes.
Snow-Credit
Snowflake cost is billed using credits. A Snowflake credit is a unit of measure, and it is consumed only when a customer is using resources, such as when a virtual warehouse is running, the cloud services layer is performing work, or serverless features are used.
To explore the credit usage, snowflake provide two options:
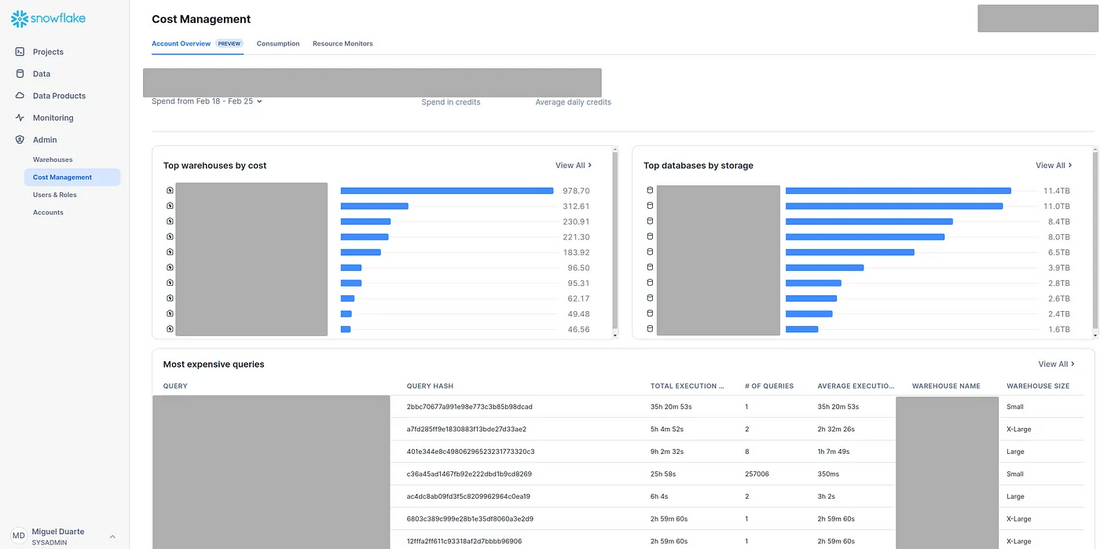
- The first option is to use the UI under the admin section, Cost management. The UI interface provides general insight on the account.
- The second option is to query the data in the system views.

While the snowflake system presents a pre-built dashboard (Option 1) for cost monitoring, it offers only general insights, lacking in-depth granularity. Notably, it doesn't support resource monitoring or regrouping costs to break down daily usage. For instance, it doesn't provide detailed information such as daily cost and usage breakdowns or the ability to regroup costs by resource size or month. To address these limitations and provide a more comprehensive solution, the objective of this blog is to develop a customized dashboard using Streamlit. This personalized dashboard will delve deeper into the data provided by the snowflake system, offering detailed insights and enabling users to monitor resource usage and costs more effectively.
Environment setup

As a first step we must prepare our snowflake environment. We will create a new database, a new virtual warehouse and query function and views to collect the account information (credit usage, warehouses, monitors).
Snowflake stores all the account information within snowflake database under the account usage schema. For this blog post we will need the following resources:
Streamlit application
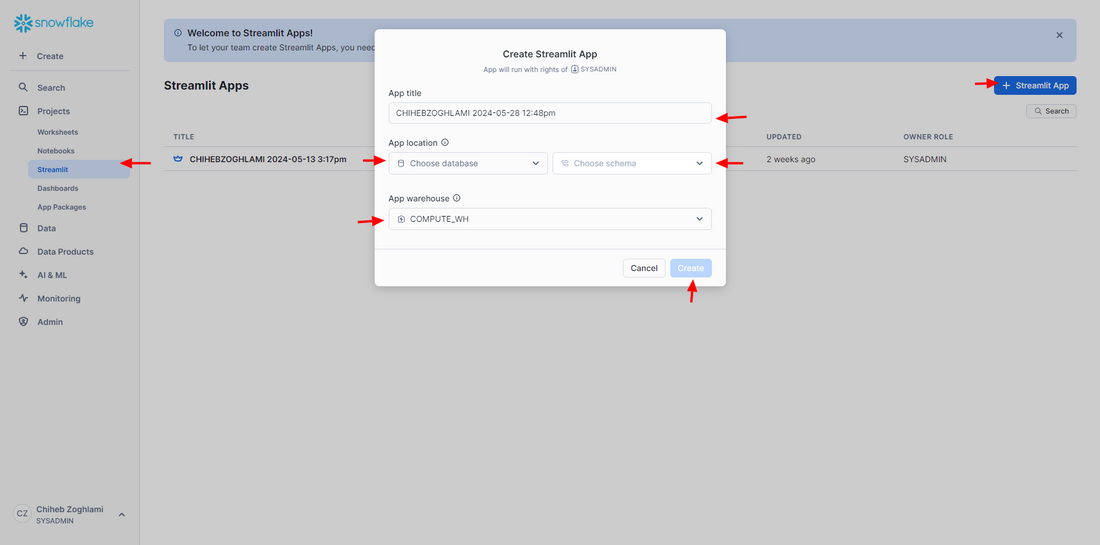
To create a streamlit application the steps are straight forward, select streamlit from the left navigation bar, select Streamlit App, provide the application name, select the virtual warehouse and the application location (database and schema) then press create.

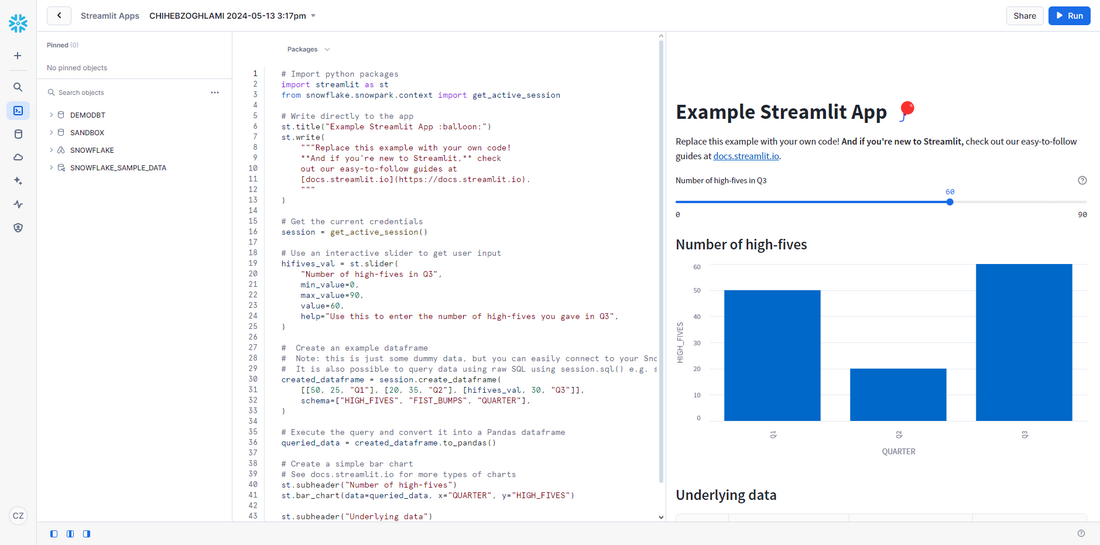
After few seconds, the application is created. The new application will contain example code as place holder. To update the application, replace the existing example code with you code then press Run.

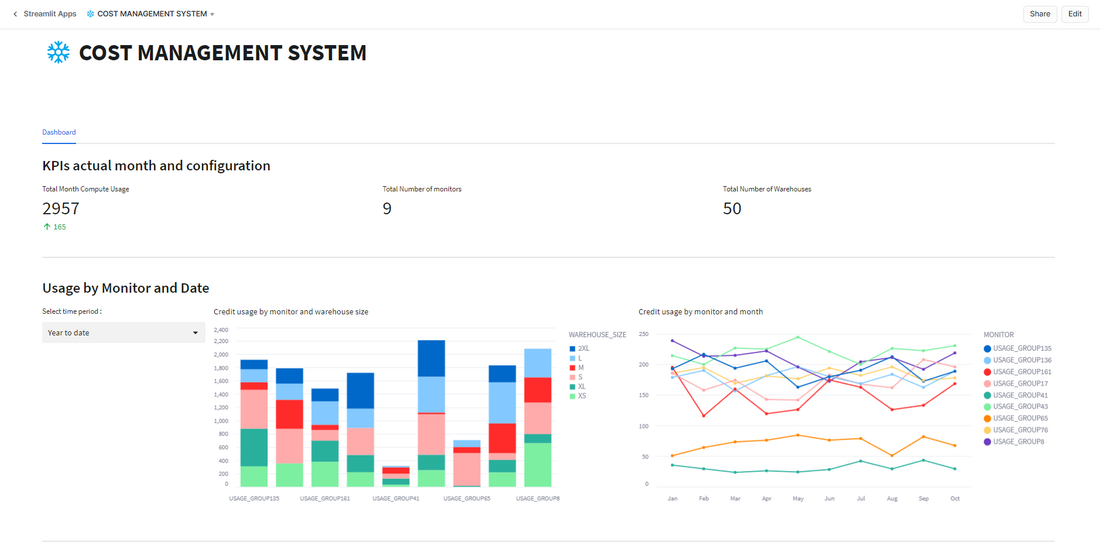
Streamlit provides a wide list of widgets that can be used to build interactive interfaces, in the following a screenshot for the resulted dashboard, that we will go through its elements step by step.

We initialize the application by removing the example code and initialize the application by importing the necessary libraries and setting the application title and the layout.
The application we are creating consist of three sections, the first section ‘KPIs actual month’ dedicated to present an overview on the snowflake environment including total credit, total number of monitors and warehouses. The second section is ‘Usage by monitor and warehouse’, in this section we split the credit usage by monitor, and warehouse. Last section will be ‘Daily usage’ section, in which we present the credit daily usage.
KPIs actual month
The ‘KPIs Actual Month’ segment comprises three cards. Initially, three columns are established, with each column dedicated to a specific card generated through a SQL query. The initial card displays the ‘Total Month Compute Usage’, this card displays a comparison between the actual month date compared to the previous month. The second card illustrates the ‘Total Number of Resources Monitors’, and the third card shows the ‘Total Number of Warehouses’.
The calculation for the first KPI, which reflects the Total month compute usage, conducted using the sum function on the WAREHOUSE_METERING_HISTORY view CREDITS_USED column. Additionally, a date filter is applied to restrict the usage to the current month.
The calculation for the second and third KPIs, which represent the total number of monitors and warehouses, involves applying the count distinct function to the output of the SHOW WAREHOUSES and SHOW RESOURCE MONITORS functions.

Usage by monitor and date
This section consists of two charts and a date range filter. The first chart is a bar chart that shows the credit usage by each monitor and splits the usage by warehouse size, the second chart is a line chart that represents the usage by monitor distributed by month. This can be built upon…

Daily usage

This section consists of three elements, the first is a resource monitor filter, the second is a table that includes the daily usage for the selected resource monitor for every warehouse and the third element consists of a line chart that displays the average daily usage vs the average daily quota predefined in the resource by the selected resource monitor.
Conclusion
In conclusion, as businesses embark on their Snowflake journey, understanding the nuances of cost is not just prudent but imperative. The landscape may be snowy, but with the right tools and insights, organizations can navigate the terrain with cost-efficiency and performance at the forefront of their Snowflake strategy and enable Use Case Owners to track their budget effectively in a visual way.

