Tableau Desktop

The intuitive self-service BI tool
Tableau Desktop provides ad hoc graphical analysis at the touch of a button. The Intuitive self-service BI tool is a versatile and easy to learn and use. With just a few clicks, turn data from disparate sources into rich visualizations and interactive dashboards. Even better: you can share the graphical ad-hoc analyses with others in seconds.
Visual & Self-Service Analytics
Welcome to Visual & Self-Service Analytics for data exploration - in real time! With Tableau Desktop, you can analyze and visualize data in minutes. Gain a whole new view of your data and access new insights that you can share in seconds. Combine multiple data views into one dashboard. Streamline your reporting by adding comments, images, or documents in an instant.

Integrated geo-database
Tableau comes with an integrated geo-database, which can enrich your reports with just a few clicks. Add individual sales territories to dashboards and visualize them as an interactive map for over 50 countries.
Connect thousands of data sources in a meaningful way
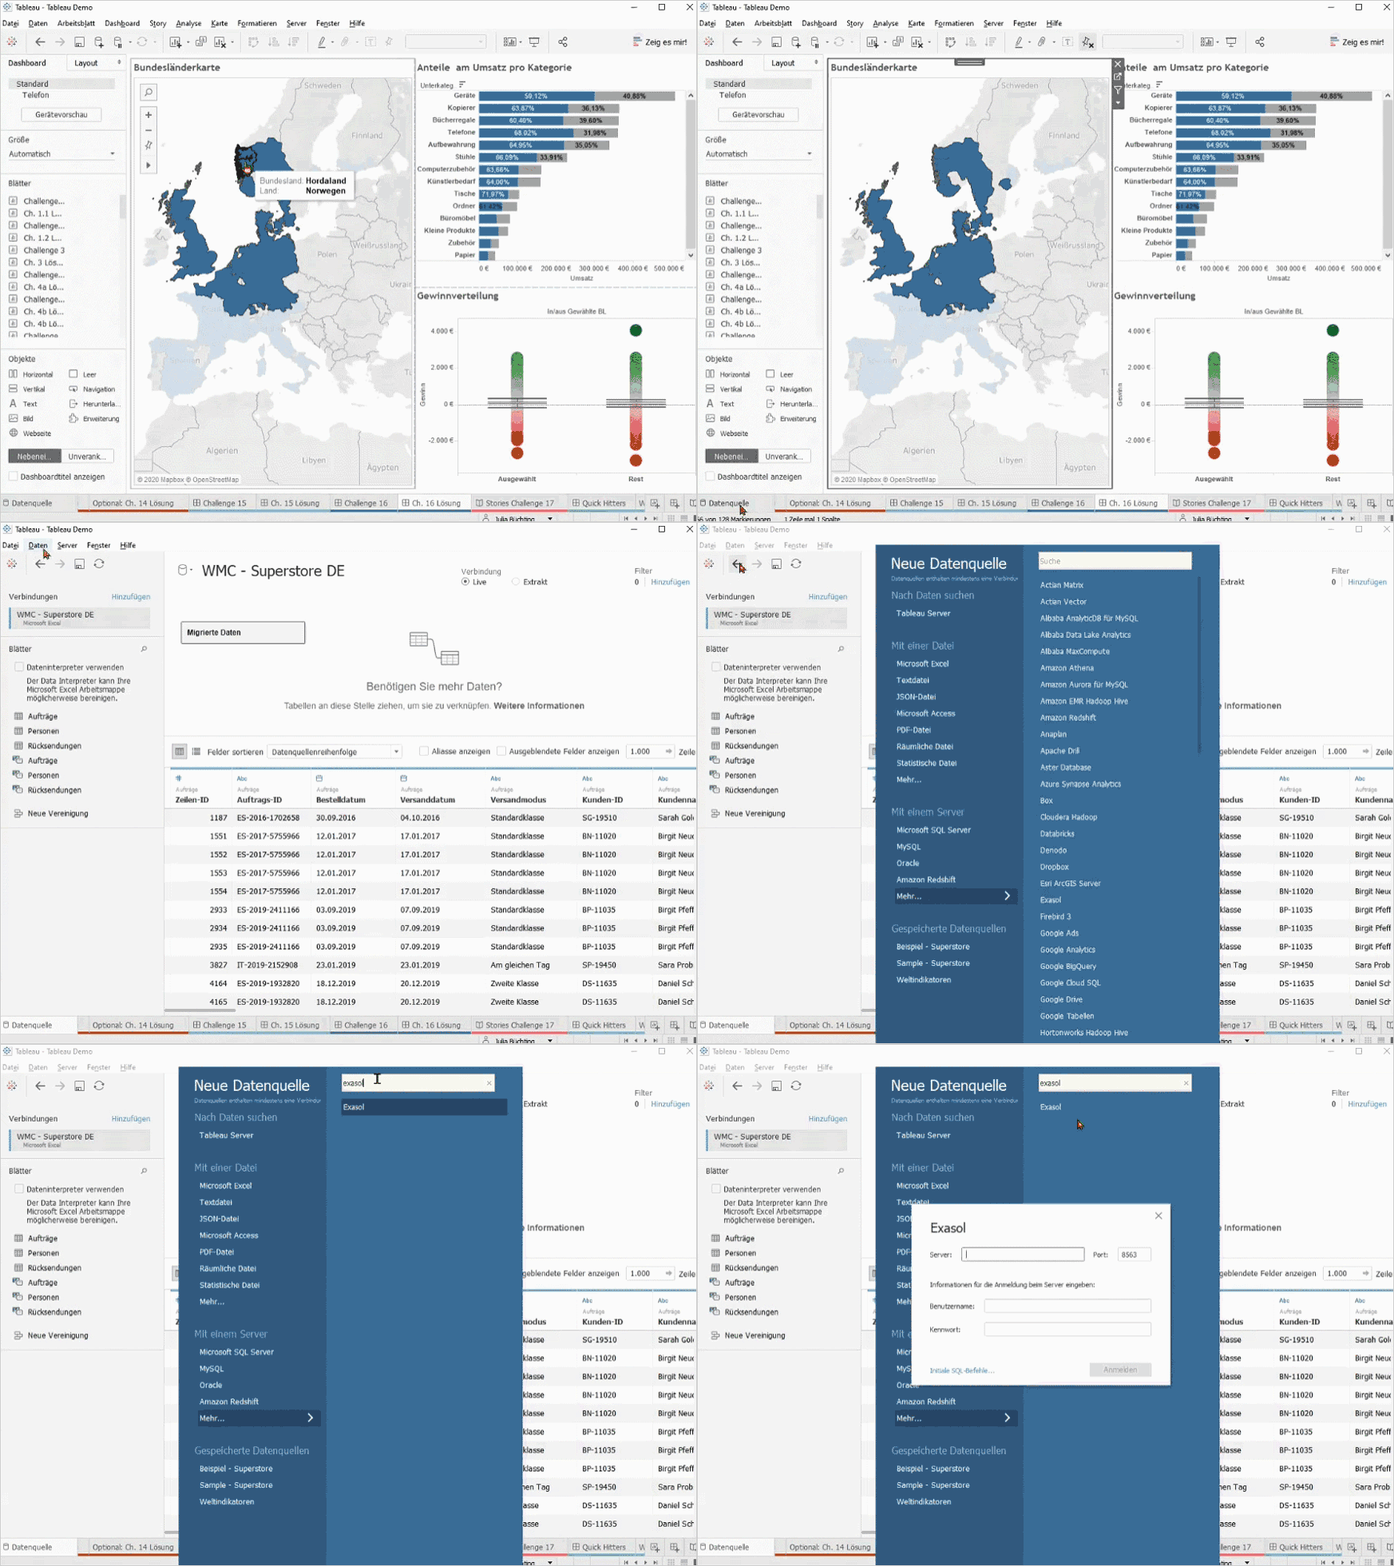
Tableau leverages both locally stored enterprise data and data in the cloud. Connect disparate source systems such as Big Data, SQL databases, spreadsheets, or cloud applications like Google Analytics and Salesforce. Here you find further examples of data sources that can be connected with Tableau.
In case the performance of the data sources is lacking, you can utilize the high-performance database technology Tableau Hyper extracts. With Tableau Hyper, you'll cache large amounts of data and design and publish rich dashboards in seconds, even on your laptop.


Intuitive use without programming knowledge
The handling of Tableau is intuitive with Drag-and-drop and no coding skills or central IT support required. You can create calculations using simple formulas like in spreadsheets, e.g. with Microsoft Excel.
Tableau simplifies advanced data analytics with Artificial Intelligence (AI). With a few clicks you can create forecasts and cluster analyses of your customers, for example, based on the integrated models. Tableau "Explain Data" offers a more detailed insight into the data basis and important correlations. Proven statistical methods such as trend analyses, regressions and correlations help to make viable, data-driven decisions.
Visualisations with Tableau Software can be created free of charge using Tableau Public and shared publicly on the web. For the full power of the end-to-end analytics platform — including controlled self-service access for your employees — we recommend upgrading to Tableau Software’s licensing model. Feel free to contact us to explore the free trial version.

