BI Battle: Tableau vs. QuickSight
1. The Opening Round
What drives a company’s success? In many cases, the targeted analysis of business-relevant data plays a key role. To derive informed business decisions from a flood of information, Business Intelligence (BI) is indispensable [1]. If you have explored BI tools before, you are almost certainly familiar with Tableau. For over a decade, it has been one of the most widely used platforms for preparing, analyzing, and visualizing data [2]. However, cloud-based solutions are gaining increasing attention, as organizations shift their data to the cloud [3]. That is where the cloud-native BI tool Amazon QuickSight comes in. Although its user base is still considerably smaller than Tableau’s, QuickSight is picking up pace due to its seamless integration with the AWS ecosystem and a flexible pricing model [4]. But which analytics platform better suits your needs? In this article, the two opponents will face off across seven disciplines to help you make an informed decision.
2. The Showdown
2.1. Cost
Compared to Tableau, QuickSight offers greater flexibility and cost efficiency thanks to its pay-per-session model for read-only users – which is especially beneficial for organizations with many occasional users [5]. Tableau offers fixed license fees per user, providing budget predictability, but costs can rise significantly with an expanding user base. QuickSight’s license pricing is also more affordable: an Author license starts at just $18/month, whereas a comparable Tableau Explorer license costs $42/month. [6] [7] Furthermore, managing a Tableau environment requires at least one Creator license at $75, while a single Author license is sufficient for QuickSight. However, Tableau’s higher cost is justified by its robust ecosystem as well as its extensive analysis and visualization capabilities – these aspects will be discussed in the following sections.

For organizations already using Amazon Web Services (AWS), QuickSight is particularly cost-efficient. It can access AWS data sources – such as S3, Redshift, or RDS – without additional integration effort, and benefits from typically low or no data transfer fees within the AWS infrastructure [8]. Tools like AWS Trusted Advisor also help identify and capitalize on cost-saving opportunities. Moreover, training expenses may be lower for QuickSight, since it is generally easier to master – making it especially attractive for teams with limited BI experience [9] [10].
2.2. Functionality
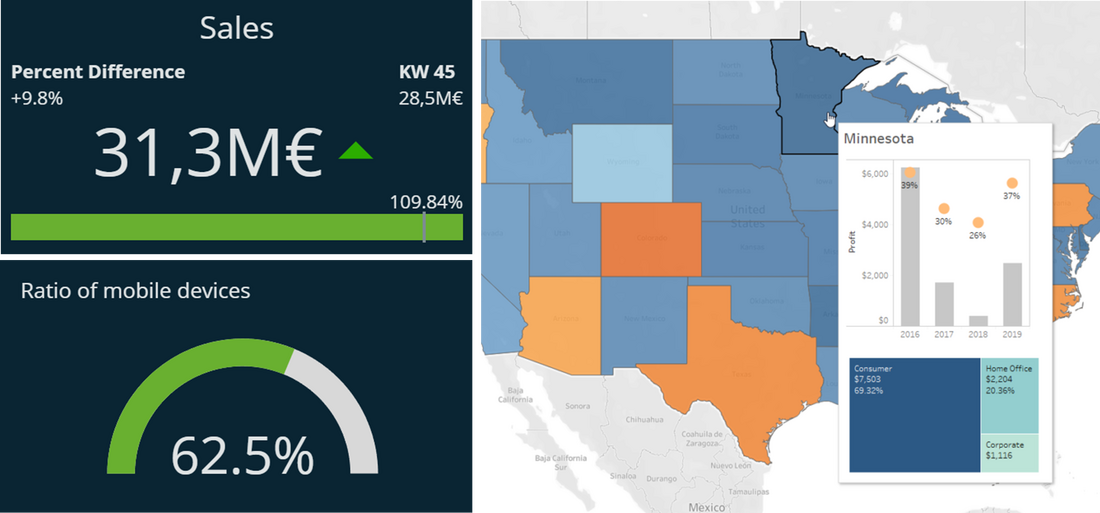
Tableau allows for more sophisticated visualizations and offers a broader range of customization options than QuickSight. However, QuickSight is constantly rolling out new features, and you can embed external resources via URLs to incorporate custom visuals. While QuickSight emphasizes core functionality and ease of use, Tableau lets you fine-tune marks, dashboard layouts, and tooltips. That said, QuickSight does shine in certain scenarios – its built-in gauge charts and KPI cards, for example, work out of the box, whereas in Tableau these chart types require workarounds.

In terms of analytical functions, Tableau takes the lead. It offers a wider array of table functions and allows for both dynamic and nested sorting and partitioning. Furthermore, its statistical analysis features are also more extensive: whereas QuickSight provides only reference lines, Tableau adds reference bands and distribution bands – enabling you, for instance, to display multiple quartiles alongside the median in a single view and highlight the areas between them.
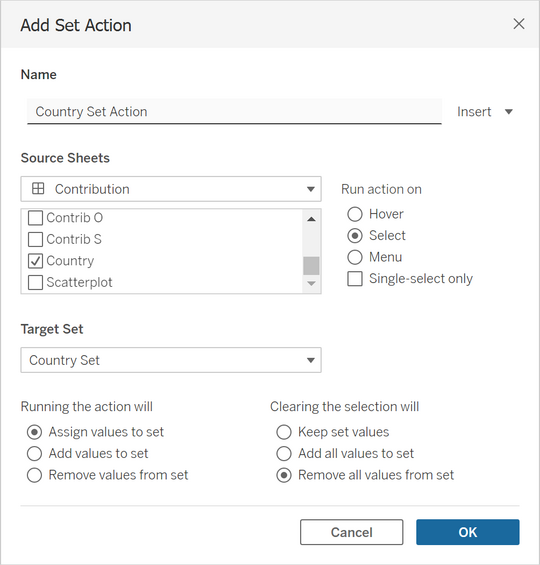
Additionally, Tableau delivers a richer set of dashboard actions: filter, highlight, parameter, and set actions are highly customizable and boost interactivity. Thanks to set actions, you can, for example, select multiple countries on a map and immediately compare their sales figures in a bar chart. By contrast, QuickSight only allows you to select a single country via a filter action.

Another advantage of Tableau is the Dynamic Zone Visibility feature. Not only can you control the visibility of individual visualizations, but you can also show or hide filters, legends, and entire containers dynamically – based on user interactions or the logged-in user. QuickSight, on the other hand, only allows you to show or hide individual visualizations using parameters and filters; their visibility cannot be controlled directly within the dashboard, as is the case in Tableau.
2.3. Machine Learning and AI
Both Tableau and QuickSight include ML-based forecasting features that require no programming on your part. These features can be used, for instance, to predict future sales figures and display them in line charts. QuickSight is also capable of detecting anomalies and alerting users via email. In this context, Tableau offers the Explain Data feature, which analyzes correlations and distributions to provide statistical explanations for outliers – however, it does not generate automated notifications. In addition, QuickSight allows you to create auto-narratives with just a few clicks, delivering concise insights that adapt to the underlying data. Similarly, Tableau presents Pulse – a solution specifically designed for mobile devices – which delivers relevant metrics and trends to business users in a personalized and context-aware format. [11] [12]

Both platforms feature AI assistants that interpret user queries using Natural Language Processing (NLP). The Tableau Agent enables you to create charts within a chat and subsequently edit them in a worksheet. QuickSight Q also supports dialog-based data exploration: using the Topics feature, you can generate visualizations by asking simple questions, which can then be added to a dashboard and further customized. Additionally, the Q feature Executive Summary generates a summary of the entire dashboard, while Data Stories produces narrative text about specific insights. Tableau also offers Data Stories, but these are limited to bullet-point summaries of individual visualizations. [12] [13]
2.4. Usability
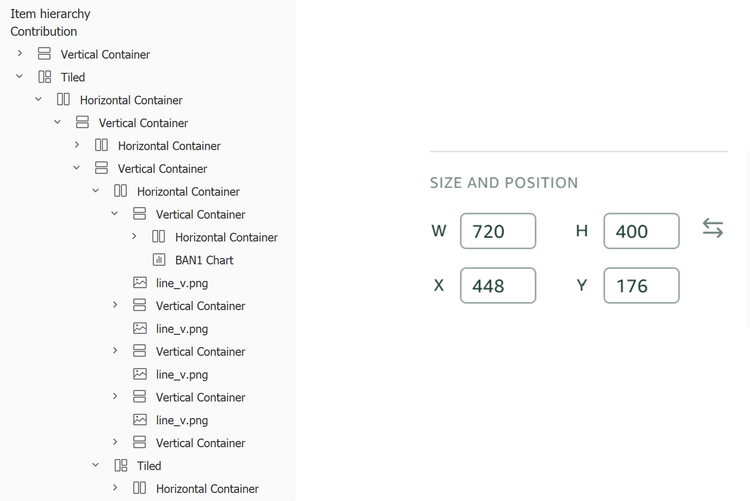
In my experience, QuickSight is easier to learn due to its highly intuitive interface and straightforward functionality. While Tableau is also relatively accessible, its steeper learning curve reflects its broader feature set – an opinion shared by many users [9] [10]. One aspect that makes QuickSight especially intuitive is the ability to edit visualizations directly in the Analysis (comparable to a Tableau dashboard), enhancing navigability. Arranging visualizations can also be more convenient in QuickSight, since you can drag them onto the dashboard at will. However, you have to manually enter their size and coordinates for pixel-perfect positioning, which can be tedious. Tableau, on the other hand, uses containers to assist layout design, though complex dashboards may become difficult to manage due to nested elements.

Tableau holds a clear advantage over QuickSight with its significantly larger user community, which provides a wealth of resources for learning and troubleshooting. This makes it easier for new users to get started with Tableau, as they can rely on tutorials and forums that offer helpful answers even to very specific questions. Although QuickSight’s community is steadily growing, it still pales in comparison to Tableau’s.
2.5. Data Sources and Preparation
Compared to QuickSight, Tableau supports a significantly broader range of data sources overall – both in the cloud and on-premises [14]. QuickSight, on the other hand, can connect to a larger number of AWS sources [15]. If a company already uses the AWS ecosystem for data storage, QuickSight proves to be the higher-performing and more cost-efficient choice thanks to its seamless integration with AWS services. [16] [9]
To prepare data for visualization in QuickSight, you can transform it in AWS Glue or Amazon Athena using code and data pipelines. These solutions are highly scalable but require solid expertise in SQL, Python, or Spark. Tableau, by contrast, provides Tableau Prep – a visual data preparation tool that business analysts without programming experience can use with ease. However, compared to the aforementioned AWS services, Tableau Prep is not designed for petabyte‑scale datasets and offers fewer options regarding transformations and job scheduling.
For data merging, Tableau offers more flexible options than QuickSight – most notably Relationships. These dynamic joins are automatically optimized per worksheet based on context to improve performance – for example, by aggregating data or adjusting the join type [17]. You can also use Tableau’s Data Blending feature to link two published data sources at runtime in selected visualizations without combining them at the data layer [18]. QuickSight, on the other hand, supports only standard joins that cannot adapt to context – aggregations and join types must be defined in advance [19].
2.6. Scalability and Administration
Since QuickSight is a serverless, fully managed service, you do not need to worry about updates, backups, or server scaling. Furthermore, if you choose the pay-per-session pricing model, increasing reader demand does not necessitate purchasing additional licenses. Tableau Cloud is also a managed service, but extra users require supplementary licenses – incurring costs even if they are not actively used. As a cloud-native tool, QuickSight handles usage spikes with ease, maintaining stable performance even under extreme load [20]. If you prefer full control over your infrastructure, Tableau Server lets you manually configure on-premises or cloud resources and define custom scaling policies [21].
The in‑memory engines of both platforms are critical to their performance. Tableau’s Hyper engine scales to a billion rows but depends on underlying hardware – very large datasets may require tuning and optimization to achieve satisfactory query speed [22]. QuickSight’s SPICE engine also supports up to a billion rows without any infrastructure management on your part [23]. However, SPICE restricts secondary tables in a join to a combined 20GB, a limitation Hyper does not impose [24]. Additionally, Hyper extracts can be stored not only as a single logical table but also as the underlying physical tables. In the latter case, joins execute at query time, which can improve performance on large extracts [25].
2.7. User Management
Tableau offers highly granular access controls for files and folders. You can specify which actions individual users or user groups may perform on specific projects, workbooks, data sources, or metrics. QuickSight, even when integrated with AWS IAM, does not match this level of precision – for example, you cannot restrict users to viewing only certain sheets of a dashboard or limit them to downloading a summary rather than the full dataset. For large, diverse teams requiring detailed permission hierarchies, Tableau is therefore the preferable choice.
Moreover, Tableau outperforms QuickSight in multi-tenancy: by isolating data, dashboards, and permissions into separate Sites, you can provide each department with its own analytics environment [26]. To achieve a similar yet less granular isolation in QuickSight, you would need to create multiple AWS accounts via AWS Organizations – adding significant setup and management overhead, such as defining cross‑account IAM roles [27].
3. The Final Verdict
If cost-saving is your top priority, QuickSight – with its affordable licensing and pay‑per‑session model – is the better choice. In terms of functionality, however, Tableau outperforms QuickSight, allowing you to create tailored visualizations and leverage advanced features – albeit with a steeper learning curve.
Both Tableau’s and QuickSight’s AI tools enable you to gain valuable insights and build dashboards with minimal manual effort. QuickSight stands out in the ML category with features like automated anomaly detection. That said, a more thorough comparison of the two platforms’ AI capabilities is needed to draw definitive conclusions.
QuickSight shines when working primarily with AWS sources, while Tableau supports a broader array of on-premises and multi-cloud sources. Within AWS, you have access to more powerful data-loading and preparation tools, whereas Tableau offers context-aware joins that QuickSight cannot match.
As a serverless, managed service, QuickSight delivers high flexibility, while Tableau Server grants you full control over your infrastructure. The in‑memory engines of both platforms perform similarly, ensuring high‑speed data analysis.
For complex team structures, Tableau is the better fit thanks to its highly granular permission management. Furthermore, QuickSight falls short in multi‑tenancy because it cannot isolate multiple analytics environments in the same way Tableau Sites can.
Ultimately, the choice of BI platform depends on your specific needs. QuickSight is the cost-efficient champion in the AWS world, whereas Tableau, as an established tool, excels at complex analytics.
Sources:
[1] „Datenanalyse: Der Schlüssel zu fundierten Geschäftsentscheidungen,“ [Online]. Available: https://www.salesforce.com/de/blog/datenanalyse/.
[2] „Tableau was named a Leader in the Gartner® Magic Quadrant™ for the 12th year,“ [Online]. Available: https://www.tableau.com/asset/gartner-magic-quadrant-2024.
[3] „The Latest Cloud Computing Statistics (updated January 2025),“ [Online]. Available: https://aag-it.com/the-latest-cloud-computing-statistics/.
[4] „AWS recognized as a Challenger in the 2024 Gartner Magic Quadrant for Analytics and Business Intelligence Platforms,“ [Online]. Available: https://aws.amazon.com/de/blogs/business-intelligence/aws-recognized-as-a-challenger-in-the-2024-gartner-magic-quadrant-for-analytics-and-business-intelligence-platforms/.
[5] „Reader Capacity pricing,“ [Online]. Available: https://aws.amazon.com/de/quicksight/capacity-pricing/.
[6] „Amazon QuickSight pricing,“ [Online]. Available: https://aws.amazon.com/quicksight/pricing/?nc1=h_ls.
[7] „Tableau Pricing,“ [Online]. Available: https://www.tableau.com/pricing.
[8] „Overview of Data Transfer Costs for Common Architectures,“ [Online]. Available: https://aws.amazon.com/de/blogs/architecture/overview-of-data-transfer-costs-for-common-architectures/.
[9] H. Tian, „Amazon QuickSight vs. Tableau – which is right for you?,“ [Online]. Available: https://www.justaftermidnight247.com/insights/amazon-quicksight-vs-tableau-which-is-right-for-you/.
[10] Daivi, „AWS Quicksight vs. Tableau - Which is The Best BI Tool For You?,“ [Online]. Available: https://www.projectpro.io/article/aws-quicksight-vs-tableau/827.
[11] „Amazon QuickSight ML Insights,“ [Online]. Available: https://aws.amazon.com/de/quicksight/features-ml/.
[12] „AI in Tableau,“ [Online]. Available: https://www.tableau.com/products/artificial-intelligence.
[13] „Amazon Q in QuickSight,“ [Online]. Available: https://aws.amazon.com/de/quicksight/q/.
[14] „Supported Connectors,“ [Online]. Available: https://help.tableau.com/current/pro/desktop/en-us/exampleconnections_overview.htm.
[15] „Supported data sources,“ [Online]. Available: https://docs.aws.amazon.com/quicksight/latest/user/supported-data-sources.html.
[16] „The Economic Benefits of Amazon QuickSight,“ [Online]. Available: https://d1.awsstatic.com/quicksight/ESG-Economic-Validation-Amazon-QuickSight-Mar-2024.pdf.
[17] „The Tableau Data Model,“ [Online]. Available: https://help.tableau.com/current/server/en-us/datasource_datamodel.htm.
[18] „Blend Your Data,“ [Online]. Available: https://help.tableau.com/current/pro/desktop/en-us/multiple_connections.htm.
[19] „Joining data,“ [Online]. Available: https://docs.aws.amazon.com/quicksight/latest/user/joining-data.html.
[20] „Amazon QuickSight features,“ [Online]. Available: https://aws.amazon.com/de/quicksight/features/.
[21] „Tableau Server,“ [Online]. Available: https://www.tableau.com/products/server.
[22] „Scaling out Tableau Extracts — Building a distributed Tableau Hyper Cluster,“ [Online]. Available: https://medium.com/starschema-blog/scaling-out-tableau-extracts-building-a-distributed-tableau-hyper-cluster-534bc6e6ba62.
[23] „Managing SPICE memory capacity,“ [Online]. Available: https://docs.aws.amazon.com/quicksight/latest/user/managing-spice-capacity.html.
[24] „Amazon QuickSight launches a 20x higher limit for SPICE JOIN,“ [Online]. Available: https://aws.amazon.com/about-aws/whats-new/2024/07/amazon-quicksight-20x-higher-limit-spice-join/?nc1=h_ls.
[25] „Extract Your Data,“ [Online]. Available: https://help.tableau.com/current/pro/desktop/en-us/extracting_data.htm.
[26] „Sites Overview,“ [Online]. Available: https://help.tableau.com/current/server/en-us/sites_intro.htm.
[27] „AWS Organizations,“ [Online]. Available: https://aws.amazon.com/de/organizations/.

