| Sabrina Schuck

Reporting for Everyone – Making Accessibility a Success

Introduction

Accessibility is no longer a niche issue – especially in the digital space, it’s becoming increasingly mandatory. From June 2025, the German Accessibility Strengthening Act (BFSG) will come into effect, requiring many providers to make their digital products and services accessible.

But beyond legal obligations, there are plenty of good reasons to embrace inclusive reporting: many people face challenges when it comes to seeing, interacting with, or understanding content – and a well-designed dashboard should be usable by everyone.

In this article, you’ll learn:

  • Why accessibility in reporting matters
  • What legal requirements and technical standards apply
  • Which simple steps you can implement right away
  • What common reporting tools offer in terms of accessibility
  • And my personal experiences with accessible reporting

What Does Accessibility in Reporting Mean?

Accessibility means ensuring that information is available to everyone – regardless of physical or cognitive impairments. Reports, dashboards, and visualisations are particularly prone to unintentionally creating barriers:

  • Colours that can’t be distinguished by people with colour vision deficiency
  • Small fonts that are hard to read on mobile devices
  • Interactive elements that require a mouse to operate
  • Charts that are unreadable or unusable for screen reader users

These kinds of barriers can arise quickly and unintentionally. However, they can make it difficult or even impossible for users with impairments to effectively use reports. Before we explore the core accessibility measures, let’s take a look at the relevant legal requirements and technical standards.

Legal Requirements & Technical Standards

Yes, there are legal frameworks and regulations governing accessibility in digital products. On 28 June 2025, Germany will introduce the Accessibility Strengthening Act (Barrierefreiheitsstärkungsgesetz – BFSG). This law is based on both European and international guidelines and standards. Here's a brief overview of the key existing regulations and standards:

Standards / Legislation

What It Means

EAA

European Accessibility Act, obliges EU member states to introduce laws and regulations that ensure accessibility.

BFSG

Accessibility Strengthening Act (BFSG), implements the European Accessibility Act (EAA) into German law. Requires German companies to ensure accessibility in line with the EAA.

BITV

Ordinance on Accessible Information Technology (BITV): Covers accessibility requirements for the websites of federal public authorities in Germany.

WCAG

Web Content Accessibility Guidelines (WCAG): A set of principles, guidelines, and criteria used to assess the accessibility of websites and apps. Certification levels are divided into A, AA, and AAA.

EN 301 549

The European standard outlines the procedures for ensuring that products and services covered by the EAA are accessible.

Best Practices for Accessible Reporting

Accessible reporting can be achieved quickly with just a few small adjustments and a bit of mindful design. Of course, this slightly changes how reports are developed, and it may mean that less space is available on your dashboards. But in return, usability improves for everyone – not just for people with disabilities.

Be intentional with colour choices

In short: You should use strong contrasts and colour palettes that are safe for people with colour vision deficiencies. Choosing colours is generally a challenging topic. Ideally, you'd like to stick to your corporate identity colours – but these are often unsuitable for reporting. The problem usually lies in poor colour differentiation and limited contrast options, even though contrast is precisely what matters most.

Moreover, colours carry meaning that varies by culture. In Western countries, green is typically associated with something positive, while red often signals something negative. As a result, these two colours are frequently used as indicators in dashboards.

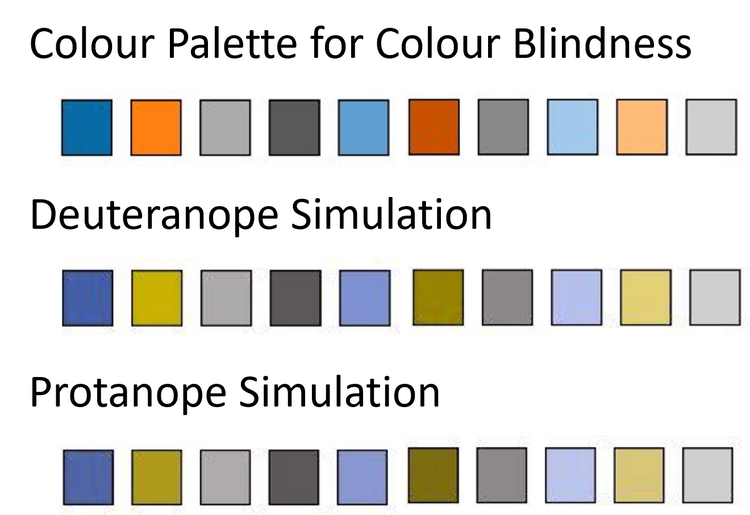
However, the likelihood of someone with a colour vision deficiency viewing your dashboard in Germany is not insignificant – around 5% of the population is affected. The solution, though, is remarkably simple: use contrast. With the help of good contrast, colours become easier to distinguish in general, and users with colour vision deficiencies can rely on contrast as an additional cue. There are several palettes designed specifically for colour vision impairments – Viridis, for example, is a well-known palette that provides strong contrast and is colour-blind friendly. Both Microsoft Power BI and Tableau include such palettes.

What matters most is the right level of contrast. You should choose bold, easily distinguishable colours on a light background. Yellow on white is hard to read even for those with normal vision. If you're using a dark background, opt for bright colours – yellow works particularly well on a deep blue background.

Protanope Simulation

If you're unsure whether the colours you've chosen are easily recognisable, or if you want to understand how a dashboard might be perceived by someone with a specific type of colour vision deficiency, there are various tools available to help. Coblis – the Color Blindness Simulator – allows you to simulate how an uploaded image would appear to people with different types of colour vision impairments. Some colour generation tools also offer the option to check how colours are perceived depending on the type of colour blindness. In addition, there are several tools for checking contrast levels, such as the Coolors Color Contrast Checker or the WebAIM Contrast Checker.

Do not convey information through colour alone

The human brain processes certain pre-attentive attributes more quickly than others. For people with normal vision, differences in colour are typically recognised faster than differences in shape. However, for individuals with colour vision deficiencies or colour blindness, the opposite is true – they are much better at distinguishing between different shapes. Using shapes can therefore make it easier to tell elements apart.

If it isn’t possible to use shapes in a chart, it’s important to ensure that a clearly labelled colour legend is provided. This allows everyone to interpret and understand the visualisation effectively.

Keep text readable

This topic often sparks debate: “Can’t we just set the font size to 7pt?” – all in an attempt to squeeze one more visualisation into the dashboard. But let’s go back to probabilities for a moment: around 67% of German adults wear glasses. That means there’s a fairly high chance that 7pt text is simply far too small to be legible. The recommended font size is 12pt. This is the standard used in most documents, so why not apply the same to reporting? Headings should also be easy to read – and can be slightly larger to aid clarity. If dashboards are intended for use on tablets or smartphones, it's essential to opt for even larger font sizes. In addition to font size, the choice of typeface plays a key role. Most modern reporting tools offer a wide selection of fonts, and the default ones are generally designed with readability in mind. But it’s not just the font and its size that determine how easily content can be read – text layout also matters. It’s important to ensure there is adequate spacing between individual values. When elements are too close together, the result feels cluttered and visually overwhelming – and above all, it becomes uncomfortable to read.

Create structure

This tip is more of a general recommendation, as it significantly improves the user-friendliness of any dashboard. A dashboard is made up of various elements, which should ideally be arranged into clearly defined sections. To ensure the most effective layout, it helps to consider common reading patterns.

Now, let’s take a closer look at the key sections of a dashboard:

  • The header area should contain a clear and meaningful title, along with a brief description of the dashboard if needed, as well as additional information such as the data source's load date.
  • The filter section is typically placed just below the header or aligned to the left. This area includes all interactive elements such as filter menus, navigation buttons, or export functions. It’s important to ensure that these controls are clearly and intuitively labelled.
  • The main section is where the real content lives – it’s where all the visualisations are presented. The arrangement of these visuals should be carefully considered and grouped thematically. Various design elements can help enhance user experience. For instance, using borders to divide sections or group related topics can be highly effective. Clear labelling is crucial here – both axis labels and data points should be easy to understand. A descriptive title paired with a short explanation also adds value. Reading direction should be taken into account, and interesting “nuggets” of information should be placed where they naturally catch the viewer’s eye. This encourages users to spend more time engaging with the dashboard.
  • The footer typically contains contact details, support information, or other supplementary content.

A well-structured dashboard is not only easier to understand, but also significantly more user-friendly for everyone. In fact, users tend to spend more time engaging with dashboards that are clearly and logically laid out. There are some fascinating eye-tracking studies that support this – and their insights can, of course, be applied to dashboard design.

Ensure keyboard accessibility

All elements should be fully operable without the use of a mouse. This depends in part on the tool used to build the dashboard or report. To ensure keyboard accessibility, there are a few key principles to follow. In general, all interactive elements – such as filter menus, dropdowns, navigation and download buttons – should be accessible using the Tab key. It helps if the currently selected element is visually highlighted, indicating focus. Most common BI tools already support this functionality. In addition, the logical reading order when navigating via the Tab key should be considered. Typically, users move line by line, from left to right – and the layout of the dashboard should reflect this. A particular challenge lies in features that are designed to work only with a mouse, such as drill-downs. In such cases, it’s important to offer alternatives, such as links that are triggered via hover text or keyboard shortcuts. Testing whether a dashboard can be operated with a keyboard is simple: just disable your mouse. Use the Tab key to move forward, and Shift + Tab to move back. It’s a test well worth doing 😉

Alt text and labelling

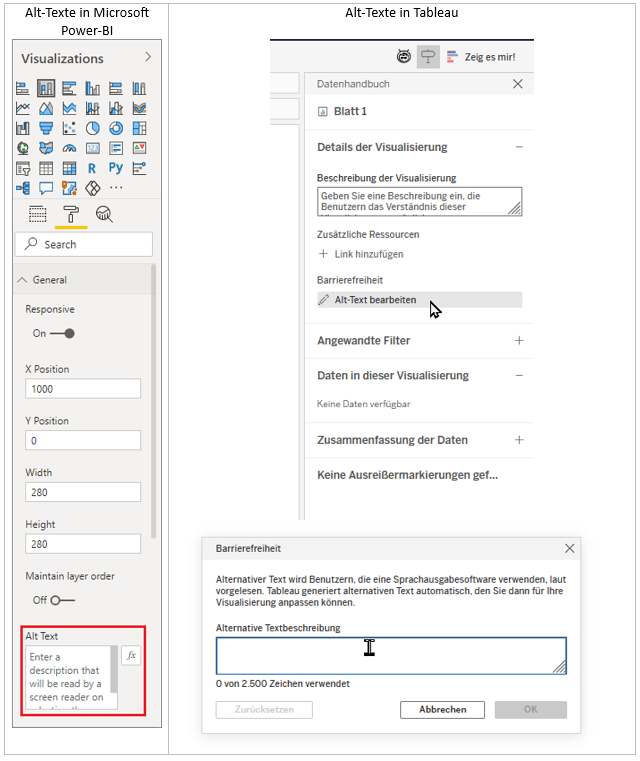
These elements are essential for screen reader users (e.g. NVDA on Windows or VoiceOver on macOS). Screen readers read aloud all content displayed on screen. If alt text is present, it will also be read aloud.

In many cases, labels and explanations take up quite a bit of space, which often leads to them being hidden behind small info buttons. However, this approach isn’t very practical for users with impairments – especially those with cognitive limitations. Alt text offers a powerful alternative: it allows detailed explanations to be included without cluttering the visible layout. Screen readers can then present the content clearly, giving every user the opportunity to fully and correctly interpret the information.

Alt-Texte Microsoft Power-BI vs. Tableau
Microsoft source: https://learn.microsoft.com/de-de/power-bi/create-reports/desktop-accessibility-creating-reports; Tableau source: https://help.tableau.com/current/pro/desktop/de-de/accessibility_create_view.htm

Use tools for accessibility checking

There are several tools available that can be used to test your work for accessibility. Below is a brief overview of some of these tools:

Tool

Description

Suitable for

Free of charge

Accessibility Insights

Can be used as a desktop app or browser plugin. Checks keyboard navigation, focus order, and ARIA errors.


Power BI, Tableau (Web), Websites

Yes

NVDA, NonVisual Desktop Access

Is the built-in screen reader for Windows. Used to test how content is read aloud for blind users.


All available on Windows.

Yes

VoiceOver

Is the screen reader for Apple devices. Checks readability and reading order for screen reader users.


Safari, Mac

Yes

WAVE Web Accessibility Evaluation Tool

Is a browser extension for Chrome and Firefox. Checks colour contrast, ARIA roles, and missing alt text.


Power BI, Tableau (Web), Embedded

Yes

Color Contrast Analyzer TSG

Checks contrast ratios between text and background.


Power BI Desktop, Tableau Desktop

Yes

Power BI Accessibility Features Checker

Integrated into Power BI Service. Lists the accessibility features of the visuals.

Power BI Services

Yes

How do Tableau and Microsoft Power BI perform when it comes to accessibility?

The focus here is on the features these tools offer to enable accessible use. This includes, for example, keyboard operability, the ability to add alt text, and much more.

Criterion

Power BI

Tableau

Keyboard operability

Well supported (tab navigation, Enter, F6, help functionality)

Limited support (not all objects fully accessible)

Screen reader support


Compatible with NVDA & JAWS in both web and desktop environments

Partial: only tables and text are reliably supported

Alternative text for visuals


Yes, can be configured individually for each visual

Yes, customisable individually

Colour contrast / Colour selection


High-contrast templates available

Manually adjustable, but no automated checking

Understandable without colour


Visual cues and pattern labelling possible

Mostly requires manual implementation

Tables & data readability


Very good support, including keyboard navigation

Tables are screen reader–friendly

Focus management / ARIA

Focus indicator and roles available (web)

Incomplete ARIA role set

Zoom capability & scaling


Good – text and elements are scalable

Manually adjustable with good results

Accessibility documentation


Comprehensive and publicly available

Partial – some community contributions available

Official accessibility certification (VPAT)


Yes, WCAG 2.1 AA compliant

Partial

At present, Microsoft Power BI performs best when it comes to accessibility. The essential features are implemented, and the tool is even WCAG 2.1 AA certified. This makes it particularly well suited for reports or dashboards that are publicly accessible and therefore subject to legal requirements and guidelines. Tableau ranks slightly lower in comparison, although it’s worth noting that recent releases have introduced several new features aimed at improving accessible use.

Checklist for Accessible Reporting

Design & Layout:

  • Use sufficient colour contrast
  • Font size of at least 11pt or scalable
  • Do not rely on colour alone to convey meaning

Interactivity:

  • Is keyboard access possible?
  • Is focus visible during tab navigation?
  • Are tooltips accessible?

Content & Structure:

  • Clearly structured headings
  • Alt text provided for graphics
  • Simple, easy-to-understand language

Technology:

  • Screen reader compatibility tested
  • Accessible PDF export (if relevant)
  • Accessibility features of BI tools utilised

My Conclusion

I’m one of the 1.2 million people in Germany living with a visual impairment, so accessibility in reporting is something that affects me directly. Based on my own experience as a developer over the past few years, this aspect is still often overlooked – and to be honest, I didn’t always pay specific attention to it either. My focus was mainly on usability and readability. Yet as developers, we have a significant influence over design, and with that comes the responsibility to make data products more inclusive.

Tools like Tableau and Microsoft Power BI already offer a wide range of accessibility features – such as alt text, built-in colour palettes, screen reader compatibility, and more. But space on a dashboard is always limited, and there’s often a temptation to cram in as much information as possible. As a result, descriptive texts may be hidden, axes removed, or fonts shrunk to the minimum. However, crowded dashboards can be restructured – and doing so also makes them more pleasant to use for people without impairments.

Lately, awareness around accessibility has grown. More and more tools are expanding and improving their accessibility functionalities. It’s also become increasingly common to move away from strict corporate colour palettes in favour of more accessible alternatives that offer better contrast and clearer differentiation.

It’s often the smallest changes that make the biggest difference. As developers, we can create accessible dashboards and reports simply by being mindful during the design phase. If we make accessibility part of our standard approach from the start, we can ensure our data products are truly available to everyone – and that should always be our goal.

Accessibility isn’t a bonus – it’s essential. Even minor adjustments can significantly improve usability – for everyone. With the right tools and an intentional design mindset, accessible reporting is much easier to achieve than you might think.


Sources

https://help.tableau.com/current/pro/desktop/de-de/accessibility_create_view.htm
https://learn.microsoft.com/de-de/power-bi/create-reports/desktop-accessibility-creating-reports
https://medium.com/gooddata-developers/5-easy-steps-to-build-accessible-dashboards-7e64f3eafc17
https://www.w3.org/TR/WCAG22/
https://www.tableau.com/de-de/blog/examining-data-viz-rules-dont-use-red-green-together
https://cran.r-project.org/web/packages/viridis/vignettes/intro-to-viridis.html

Sabrina Schuck

Sabrina has been working as a Senior Consultant at Woodmark since October 2021, with a focus on Business Analytics and Visual Analytics. In her client projects, she is involved in requirements analysis, the development and enhancement of dashboards, as well as performance optimization. In addition, Sabrina is part of our Tableau trainer team and serves as the leader of the Tableau User Group Munich.

To overview blog posts